
As a user researcher working on immigration case working, I was recently asked ‘How will this new shiny thing you’re designing deliver value?’
'Because it’s new and shiny' isn’t a good answer.
What the new shiny thing should be doing is improving the old outdated thing, reducing overheads and helping to create more efficient services. Quantifying the value of this often feels like guesswork, so I decided to try and measure it.
Get to know the process
I started looking at how case workers were currently doing things. They followed a fairly consistent linear process, so I was able to get a deep understanding of the existing systems.
Doing this allowed me, and will allow you, to identify tasks and how they can be grouped together.
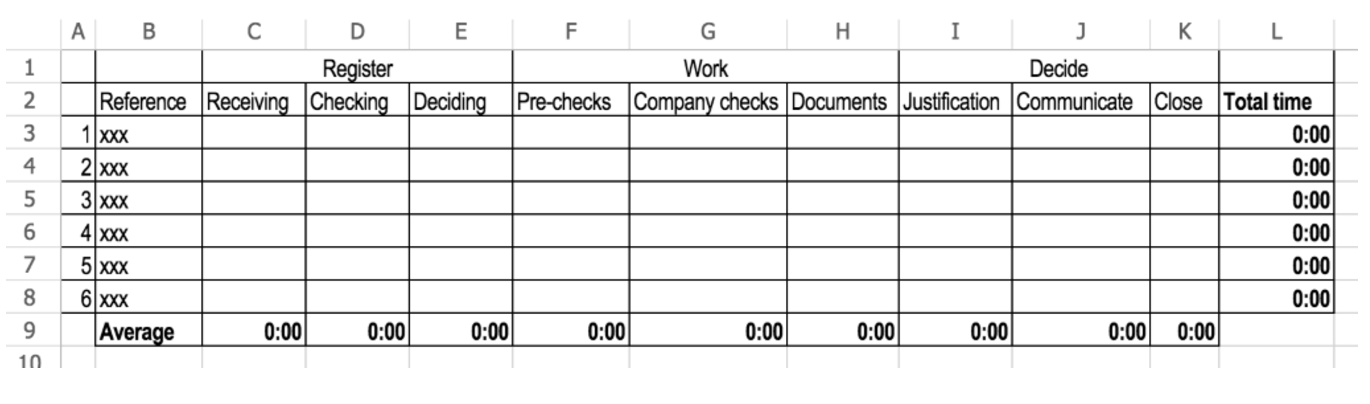
Record time against tasks
You need to break tasks down into columns so that you have plenty of space for multiple processes. Excel works well for this - it does the hard calculations for you.
Go to your users armed with your spreadsheet and a stopwatch. Be clear that you're not monitoring their performance. You're only interested in how they're using systems so that you can help make things better. I was careful to explain that I wasn't testing users or comparing their times with anyone else.
If users ask others for help completing tasks, be sure to include this in your timings. Keep details of what they ask - it could be a known pain point or something new to look into.
If you can, record at least 5 users for each task. The more timings you get the more reliable your averages will be.
Imagine I'm not here
It's true, people change their behaviour when researchers are around. Set the scene by saying something like: “I’ll just sit quietly and watch. You don’t need to talk me through anything, just do what you usually do”.
When observing users, sit close enough to see what they're doing but not so close that you distract them. I found it helped to sit out of the user's direct line of sight.
Get your baseline
So, you've got all your timings in your fabulous spreadsheet. Before you work out average times, you need to deal with any outlying times. If timings for one task are between 4 and 6 minutes but you have one at 15 minutes, find out why. If it includes non-task related activities like chatting about EastEnders at the printer, remove it from the sample.
And, the value is...
Once you have average times, you’ve got a great baseline to test against. You can also answer the big question of value.
Telling stakeholders that a task takes an average of 5 minutes 12 seconds might not mean much to them. But, if that task is carried out 85,000 times a year the costs are tangible and any reduction in time taken becomes a real value.
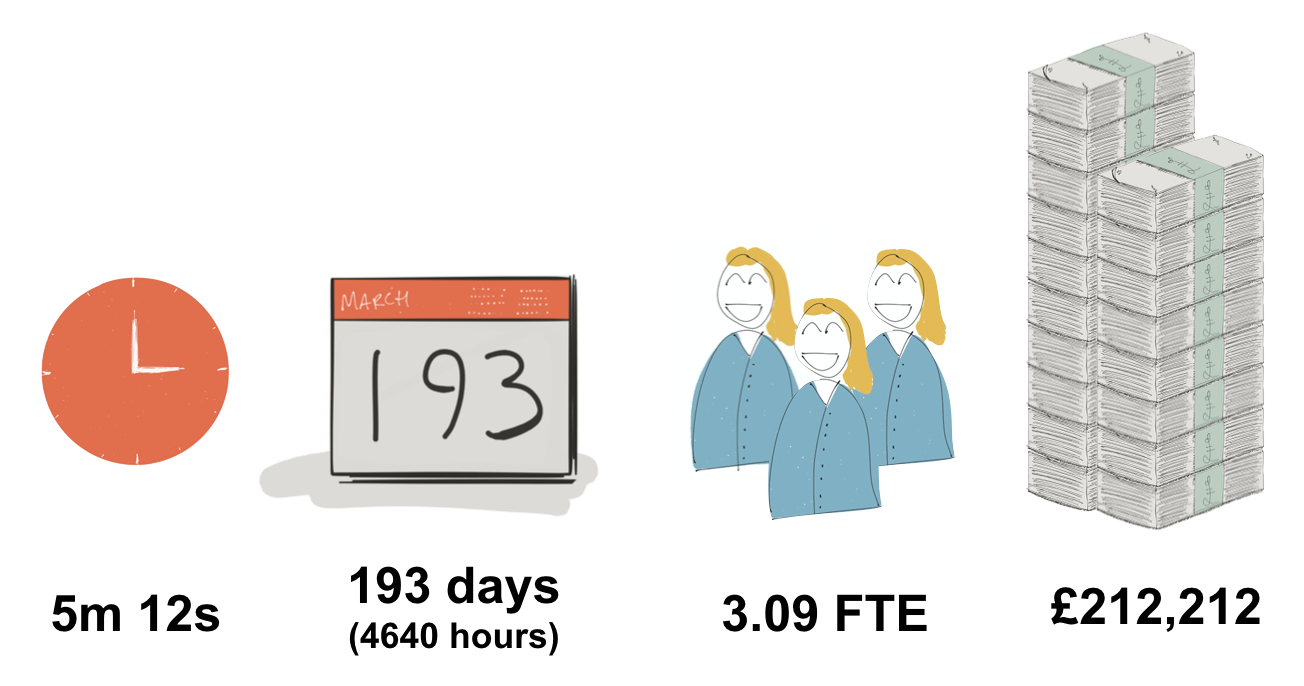
Plus, there’s nothing better than showing how costly an existing process is to get support for a better, user-focussed service (formerly known as the new shiny thing).
4 comments
Comment by Jane Devine posted on
That's really useful and producing the spreadsheet doesn't sound like a too time consuming job to do. I really like the graphic that explains cost savings to stake holders too.
Comment by Rob Le Quesne posted on
Great post, Ollie. Thanks for sharing.
It raises the question how we can get better at measuring and sharing service effort across all service users, both end user and caseworkers.
Comment by Cat Macaulay posted on
Great post thanks Ollie and Rob yes where we can measure things easily like this it's important we start to think about that from a user point of view. Ollie have you looked at harder to measure quantifiably things, such as reductions in anxiety and stress?
Comment by Oliver Beal posted on
Thanks Cat. I’ve done some initial thinking on measuring things like feelings and stress but need to do more to understand a solid way of measuring these. Looked at how others do this through surveys and open-ended questioning but more testing is needed to get a useful way of measuring for the services we’re building. If its something your interested in or have been working on would be happy to work together to identify a solution.